ANALYTICS
Numbers that drive
decisions, not reports.
decisions, not reports.
AI analytics that shows trends, risks, and recommended actions — not just tables of numbers.


STAT CARDS WITH TRENDS
24
active projects
73%
on schedule
3
at risk
€2.1M
total budget


AI AUTOMATION SCHEDULE
08:55 digest
09:00 deadlines
21:00 snapshots
03:00 backup
PROJECT HEALTH INDICATORS
75%
Scope
Requirements covered
60%
Time
Timeline progress
88%
Budget
Budget utilized
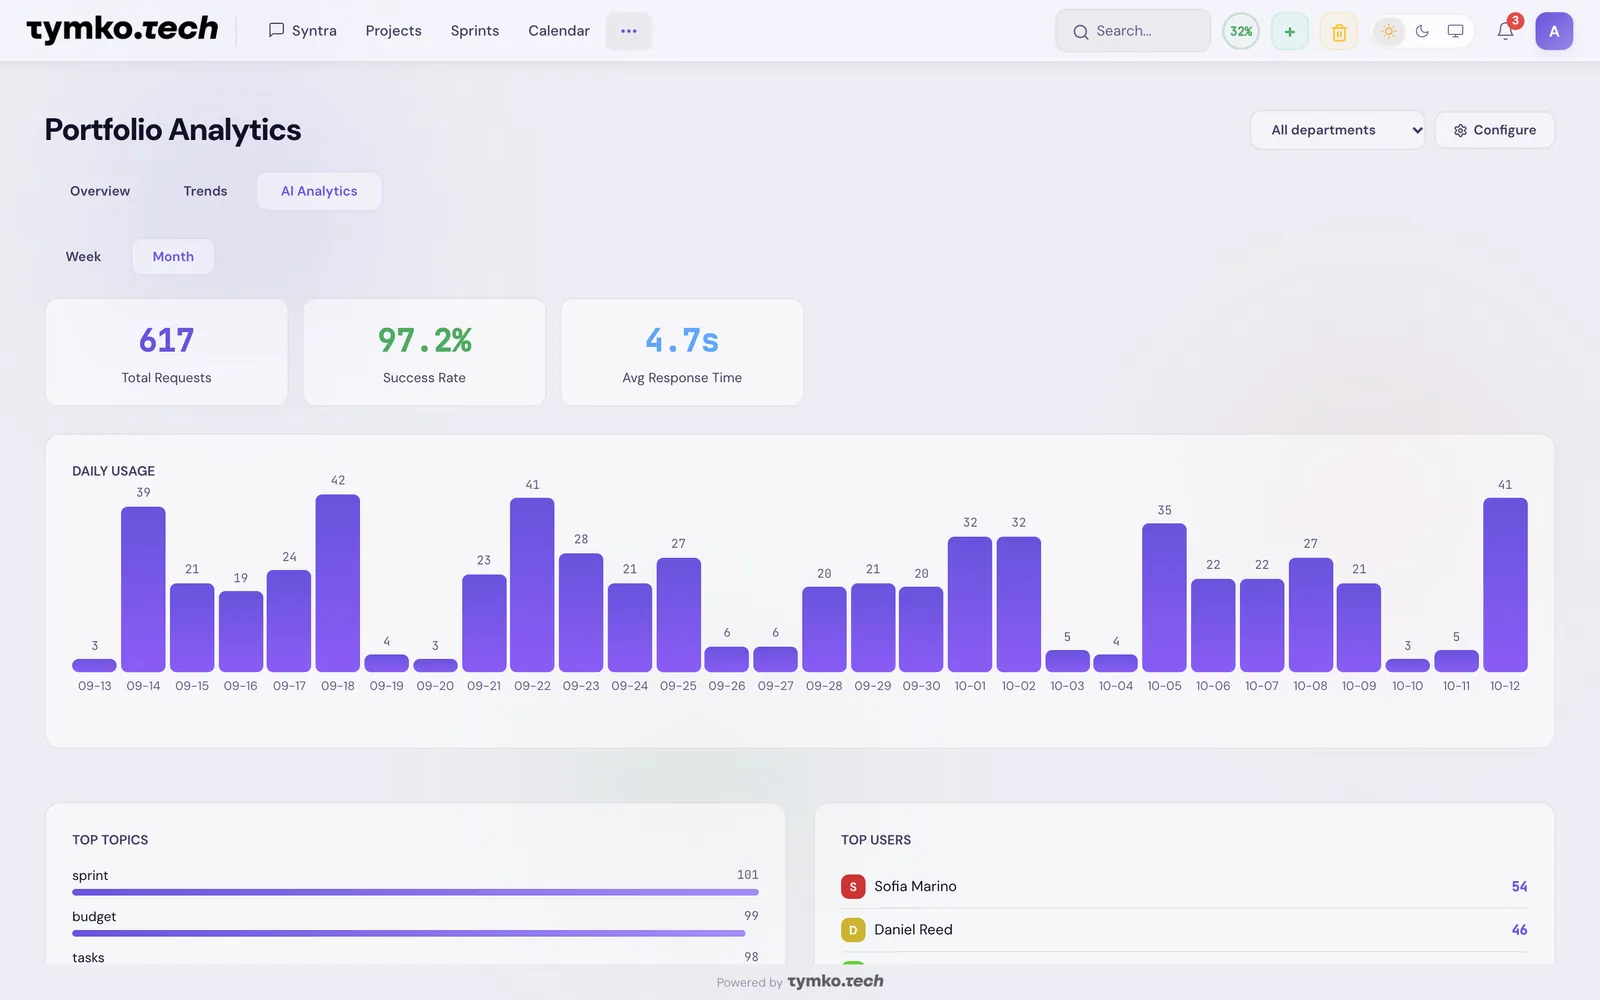
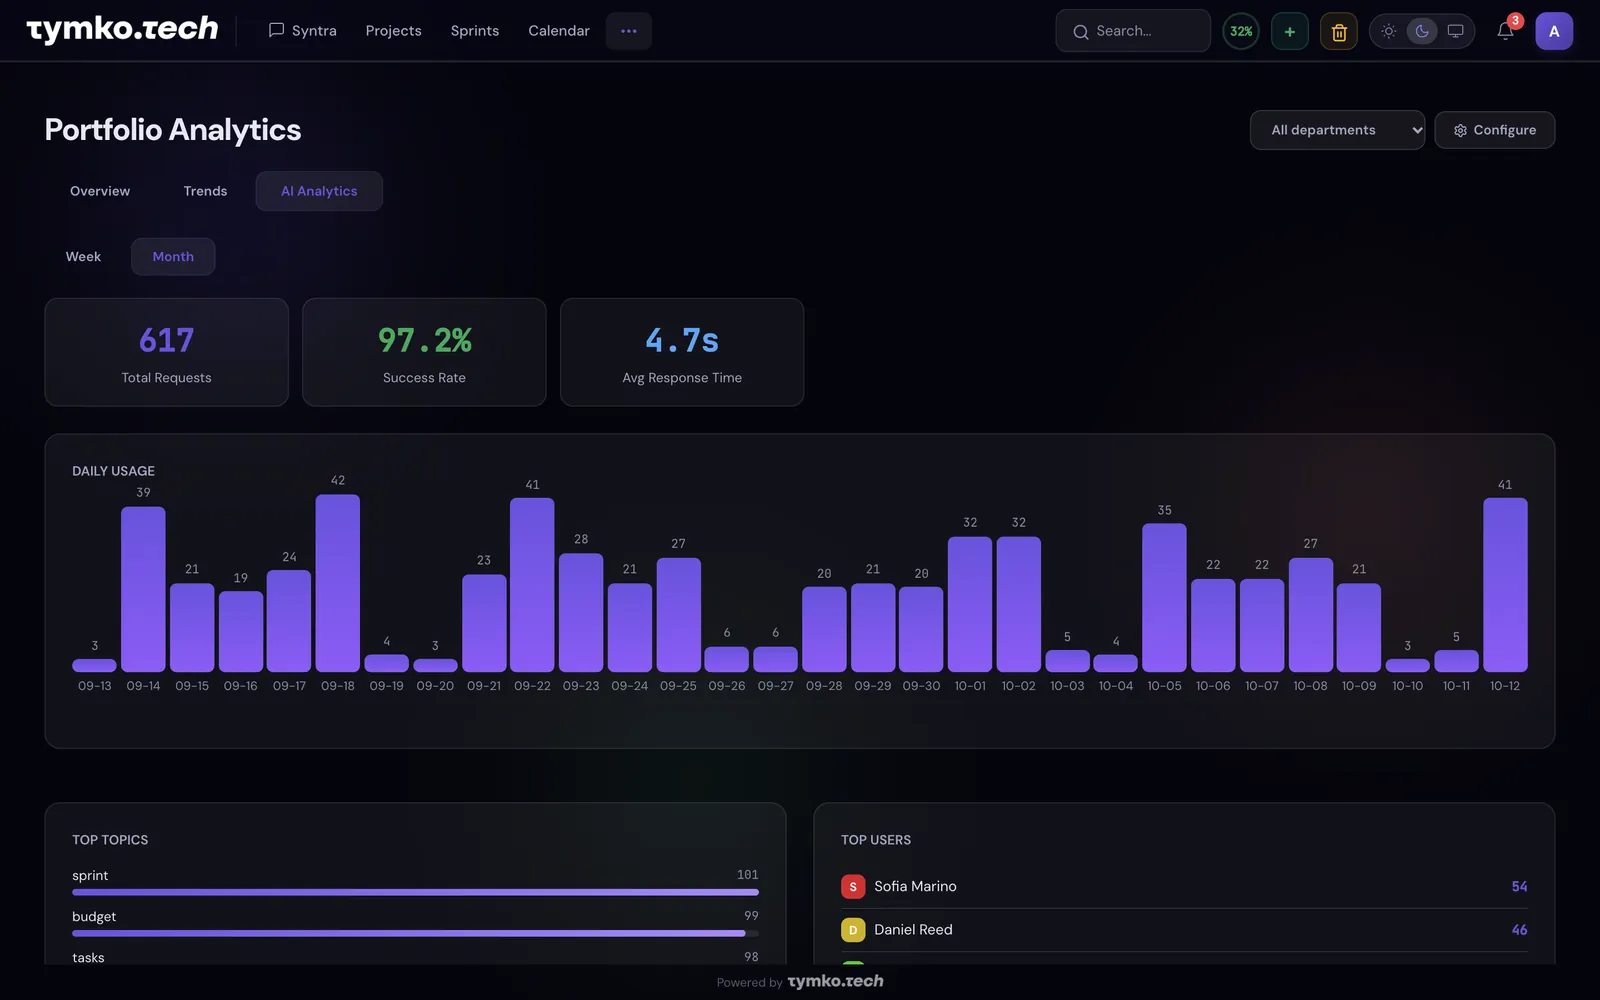
Not a dashboard for reports. A tool for decisions.
AI analytics proactively identifies problems before they escalate. Not just visualization — intelligent monitoring. Ready-made reports sit in one Reports menu on the projects page: a portfolio PDF in a light design with your company logo (landscape A4), Excel with project and task sheets, and the risk register as PDF or Excel.
← All features · Powered by 